Placeholder Content Image

5 reasons to check on your elderly neighbour during a heatwave

<p>We all know someone who insists on wearing a cardigan in summer or refuses to turn on the air conditioning because “it’s not that hot”. Chances are this is an older person, and there’s a good reason for that.</p> <p>As we get older, we tend to not “feel” the heat <a href="https://www.sciencedirect.com/science/article/pii/S1568163710000450?casa_token=LxiONa0xZXQAAAAA:8IYLW0YquTHHUGkd2qiMgz6FNU3y2f4FIW96Lu9a-gjbAWw8iOgt7AOQ9C0UWMmDtXWOkqw#fig4">as much</a> even though our bodies are <a href="https://journals.physiology.org/doi/full/10.1152/japplphysiol.00202.2003">less able to handle the heat</a>. This contradiction can have <a href="https://www.sciencedirect.com/science/article/pii/S0160412017321980?casa_token=-nCG3M20MawAAAAA:VYwlO1kZIpibQnCLlm4LuSKMkK9nNvOgvdrXzUPHglOknNKp20UX0oty1DS2uWrlCZnoZhg">lethal consequences</a>, especially during periods of extreme heat.</p> <p>So, why is extreme heat so dangerous for older people? And what can we do to help?</p> <h2>Why are older people at risk?</h2> <p><a href="https://www.sciencedirect.com/science/article/pii/S2212420921006324">Extreme heat kills</a> more Australians than <a href="https://www.sciencedirect.com/science/article/pii/S1462901114000999">all other natural hazards</a>, and people aged 60 or older account for 69% of those deaths.</p> <p>There are five key reasons we’re more susceptible to heat as we get older.</p> <p>1. Bodily changes</p> <p>One of the main ways we lose excess heat, <a href="https://www.ncbi.nlm.nih.gov/pmc/articles/PMC3228253/">blood flowing to our skin</a>, isn’t as effective as we get older. This is in part because the blood vessels in our skin don’t expand fast enough, and we may have less blood pumping with each beat of our heart.</p> <p><a href="https://www.sciencedirect.com/science/article/pii/S016041202031864X#f0010">Many other changes</a> in our bodies also lead us to gain and store more heat as we get older. These include how our bodies control sweat and how well our kidneys balance fluid, which are both important for staying cool.</p> <p>2. Social isolation</p> <p>Loneliness and social isolation are <a href="https://www.sciencedirect.com/science/article/pii/S1064748120304425">health risks</a> on their own, but also <a href="https://www.sciencedirect.com/science/article/pii/S0160412020318237#b0065">multiply the risk</a> of heat-related illness.</p> <p>A South Australian <a href="https://www.mdpi.com/1660-4601/10/12/6721">survey</a> of older people showed those who were socially isolated were less confident in asking for help during a heatwave.</p> <p>This is concerning as many older Australians <a href="https://www.aihw.gov.au/reports/older-people/older-australians/contents/housing-and-living-arrangements">live alone</a>, and we are more likely to live alone as we get older.</p> <p>3. Beliefs and behaviour</p> <p>Older Australians may not respond to heat in ways that protect their own health and wellbeing. Australian culture tends to view heat tolerance as a matter of <a href="https://www.ncbi.nlm.nih.gov/pmc/articles/PMC3290974/">resilience</a> and <a href="https://www.tandfonline.com/doi/full/10.3402/gha.v5i0.19277">identity</a>, where there is a sense of generational pride in being able to cope with the heat.</p> <p><a href="https://www.sahealth.sa.gov.au/wps/wcm/connect/c67cf100436d8e7082a2dfc9302c1003/Adaptive+capabilities+in+elderly+people+during+extreme+heat+events+in+SA+-+Public+Health+Service+-+scientific+services+20140328.pdf?MOD=AJPERES&CACHEID=ROOTWORKSPACE-c67cf100436d8e7082a2dfc9302c1003-nKKgCmQ">Reports also suggest</a> many older people have concerns about the cost of air conditioning, may be hesitant to use it, or accidentally use reverse cycle units as heaters.</p> <p>4. Medical issues</p> <p>Many chronic illnesses that are more common with age are also associated with an increased risk for heat-related illness. Because blood flow is so important for regulating our body temperature, it’s not surprising that conditions such as <a href="https://www.sciencedirect.com/science/article/pii/S1071916417300969?casa_token=LEe23NWx7V0AAAAA:-cw7TgysaYdqXq0FTuTtIxxE3Oua1NImlwmmvWWSyt39guUUWbzOsevcsoBI8tw5hbbkwaI">heart failure</a> and <a href="https://www.ncbi.nlm.nih.gov/pmc/articles/PMC4861190/">diabetes</a> are associated with increased heat risk.</p> <p>Similarly, many medications commonly prescribed for chronic illnesses can <a href="https://www.health.vic.gov.au/environmental-health/extreme-heat-information-for-clinicians">interfere</a> with how our body regulates temperature. For instance, some blood pressure medicines reduce our ability to sweat and lose heat.</p> <p>5. Home environment</p> <p>It is <a href="https://www.anglicare.asn.au/wp-content/uploads/2022/09/Australia-Fair-Ageing-in-Place.pdf">increasingly difficult</a> for older Australians to find affordable and appropriate housing, especially pensioners and renters.</p> <p>Poor home design, lack of insulation, inability to pay their energy bills, and limited income <a href="https://cur.org.au/cms/wp-content/uploads/2016/12/heatwaveshomeshealth-briefing-paper_rmit-2.pdf">all contribute</a> to being vulnerable to heatwaves in Australia. This is particularly troubling as energy prices soar.</p> <h2>What can we do?</h2> <p>Older Australians</p> <p>Knowing the risks of extreme heat is the first step. Don’t <a href="https://www.mdpi.com/1660-4601/10/1/1">underestimate</a> your own risk during a heatwave.</p> <p>There are many practical ways we can all keep ourselves and our homes cool, both safely and efficiently. These include:</p> <ul> <li>using a fan, <a href="https://theconversation.com/how-humid-is-it-3-things-to-keep-you-cool-in-a-hot-and-sticky-summer-and-3-things-that-wont-176365">which is effective</a>, especially when it’s humid, but may <a href="https://www.sciencedirect.com/science/article/pii/S0003687014001355?casa_token=NoCMHlZZ_SUAAAAA:vu-Yk1WnHpy5RsumlwQ-5_SvvuMjJLeV5Cm087QTUYKI6kLUKwjnZ1-FuATlzGDC36WyCTI">not be enough</a> when it’s very hot and dry. If you have an air conditioner, consider using it</li> <li> <p>knowing the conditions inside your home by installing thermometers that ideally also <a href="https://theconversation.com/how-humid-is-it-3-things-to-keep-you-cool-in-a-hot-and-sticky-summer-and-3-things-that-wont-176365">measure humidity</a> so you know which ways will work best to cool down</p> </li> <li> <p>opening windows facing away from the sun when it’s cooler outside; otherwise keep blinds closed in the heat of the day</p> </li> <li> <p>taking cool showers or applying a damp cloth to the back of your neck can help cool the skin</p> </li> <li> <p>taking regular, small drinks of water, even when you’re not thirsty (unless you have <a href="https://www.betterhealth.vic.gov.au/health/healthyliving/heat-stress-and-older-people#how-to-help-an-older-relative-or-friend">heart or kidney problems</a> in which case you need to talk to your doctor first as too much water may be a problem for you)</p> </li> <li> <p><a href="https://www.sahealth.sa.gov.au/wps/wcm/connect/6023f98b-bdcf-416b-9d3a-cfff9ea728c8/A4+Poster+-+Signs+and+symptoms+of+heat+illness.pdf?MOD=AJPERES&CACHEID=ROOTWORKSPACE-6023f98b-bdcf-416b-9d3a-cfff9ea728c8-nwMnDGl">knowing the signs</a> of heat exhaustion and heat stroke.</p> </li> </ul> <p>Older relatives, friends and neighbours</p> <p>We can all keep an eye on our older relatives, friends and neighbours as:</p> <ul> <li> <p>keeping in touch is <a href="https://link.springer.com/article/10.17269/s41997-020-00309-2">great protection</a> from heat-related illness; check in regularly</p> </li> <li> <p>when an older person can’t keep the house cool, support a day trip to a cooler place such as a library, cinema, or shopping centre</p> </li> <li> <p>encourage them to talk to their doctor about how medical conditions or medications might increase their risk to heat.</p> </li> </ul> <h2>We need to raise awareness</h2> <p>Australians are growing complacent about the health risks of extreme heat, see heatwaves as normal and public health messages <a href="https://widgets.figshare.com/articles/7618403/embed?show_title=1">aren’t cutting through</a> any more.</p> <p>It’s also important to remember that older people aren’t all the same, so any public health approaches to extreme heat should be tailored to <a href="https://www.sciencedirect.com/science/article/pii/S0959378010001135?casa_token=e3YcjpeKWsgAAAAA:jzFlD6Wk7dvO05YEuoteZ0jUmMVc6eJczVhLxpDcw8qrLvCoTkvo2dz_wH_puWE-frzQNx4">communities and individuals</a>.</p> <p>One way we’re trying to help is by working directly with older people. Together, we’re <a href="https://www.griffith.edu.au/research/climate-action/climate-transitions/health/ethos-project">researching and developing a smart device</a> that makes it easier to know when your house is getting warm, and customising strategies you can use to cool down safely.</p> <p style="box-sizing: border-box; margin-top: 0px; margin-bottom: 1rem; color: #212529; font-family: -apple-system, 'system-ui', 'Segoe UI', Roboto, 'Helvetica Neue', Arial, sans-serif, 'Apple Color Emoji', 'Segoe UI Emoji', 'Segoe UI Symbol', 'Noto Color Emoji'; font-size: 16px; background-color: #ffffff;"><em style="box-sizing: border-box;">Image credits: Getty Images</em></p> <p style="box-sizing: border-box; margin-top: 0px; margin-bottom: 0px; color: #212529; font-family: -apple-system, 'system-ui', 'Segoe UI', Roboto, 'Helvetica Neue', Arial, sans-serif, 'Apple Color Emoji', 'Segoe UI Emoji', 'Segoe UI Symbol', 'Noto Color Emoji'; font-size: 16px; background-color: #ffffff;"><em style="box-sizing: border-box;">This article originally appeared on <a href="https://theconversation.com/5-reasons-to-check-on-your-elderly-neighbour-during-a-heatwave-196218" target="_blank" rel="noopener">The Conversation</a>. </em></p>

Retirement Life

Placeholder Content Image

Princess Diana's childhood home catches fire

<p dir="ltr">Soaring temperatures in the UK have caused fires to spark across the nation - with London’s firefighters recording their busiest day since WWII - with one of the many homes at risk including at Althorp House, the childhood home of Princess Diana.</p> <p dir="ltr">The home is now owned by Earl Charles Spencer, Diana’s brother. His wife, Karen Spencer, shared the news of the blaze on social media.</p> <p dir="ltr">“Fire in one of our fields today,” Countess Spencer wrote in an Instagram story on Tuesday.</p> <p><span id="docs-internal-guid-bc80c0bc-7fff-87a4-506b-d99e4e28410d"></span></p> <p dir="ltr">She later shared a follow-up video reassuring followers the situation was “under control” thanks to the “amazing” local fire department and team at Althorp.</p> <p dir="ltr"><img src="https://oversixtydev.blob.core.windows.net/media/2022/07/diana-fire2.jpg" alt="" width="1280" height="720" /></p> <p dir="ltr"><em>Karen Spencer documented the fire that sparked at Althorp House and praised the “amazing” work of firefighters in quenching it. Images: Instagram</em></p> <p dir="ltr">Later that day, Earl Spencer posted a photo on his Instagram page of the home after it began to rain.</p> <p dir="ltr"><span id="docs-internal-guid-c3f339c8-7fff-b093-203d-d766ca2603ec"></span></p> <p dir="ltr">“Althorp enjoying a few drops of rain tonight that follow the hottest recorded day England has ever had,” he captioned the shot.</p> <blockquote class="instagram-media" style="background: #FFF; border: 0; border-radius: 3px; box-shadow: 0 0 1px 0 rgba(0,0,0,0.5),0 1px 10px 0 rgba(0,0,0,0.15); margin: 1px; max-width: 540px; min-width: 326px; padding: 0; width: calc(100% - 2px);" data-instgrm-captioned="" data-instgrm-permalink="https://www.instagram.com/p/CgNO32OsTdC/?utm_source=ig_embed&amp;utm_campaign=loading" data-instgrm-version="14"> <div style="padding: 16px;"> <div style="display: flex; flex-direction: row; align-items: center;"> <div style="background-color: #f4f4f4; border-radius: 50%; flex-grow: 0; height: 40px; margin-right: 14px; width: 40px;"> </div> <div style="display: flex; flex-direction: column; flex-grow: 1; justify-content: center;"> <div style="background-color: #f4f4f4; border-radius: 4px; flex-grow: 0; height: 14px; margin-bottom: 6px; width: 100px;"> </div> <div style="background-color: #f4f4f4; border-radius: 4px; flex-grow: 0; height: 14px; width: 60px;"> </div> </div> </div> <div style="padding: 19% 0;"> </div> <div style="display: block; height: 50px; margin: 0 auto 12px; width: 50px;"> </div> <div style="padding-top: 8px;"> <div style="color: #3897f0; font-family: Arial,sans-serif; font-size: 14px; font-style: normal; font-weight: 550; line-height: 18px;">View this post on Instagram</div> </div> <div style="padding: 12.5% 0;"> </div> <div style="display: flex; flex-direction: row; margin-bottom: 14px; align-items: center;"> <div> <div style="background-color: #f4f4f4; border-radius: 50%; height: 12.5px; width: 12.5px; transform: translateX(0px) translateY(7px);"> </div> <div style="background-color: #f4f4f4; height: 12.5px; transform: rotate(-45deg) translateX(3px) translateY(1px); width: 12.5px; flex-grow: 0; margin-right: 14px; margin-left: 2px;"> </div> <div style="background-color: #f4f4f4; border-radius: 50%; height: 12.5px; width: 12.5px; transform: translateX(9px) translateY(-18px);"> </div> </div> <div style="margin-left: 8px;"> <div style="background-color: #f4f4f4; border-radius: 50%; flex-grow: 0; height: 20px; width: 20px;"> </div> <div style="width: 0; height: 0; border-top: 2px solid transparent; border-left: 6px solid #f4f4f4; border-bottom: 2px solid transparent; transform: translateX(16px) translateY(-4px) rotate(30deg);"> </div> </div> <div style="margin-left: auto;"> <div style="width: 0px; border-top: 8px solid #F4F4F4; border-right: 8px solid transparent; transform: translateY(16px);"> </div> <div style="background-color: #f4f4f4; flex-grow: 0; height: 12px; width: 16px; transform: translateY(-4px);"> </div> <div style="width: 0; height: 0; border-top: 8px solid #F4F4F4; border-left: 8px solid transparent; transform: translateY(-4px) translateX(8px);"> </div> </div> </div> <div style="display: flex; flex-direction: column; flex-grow: 1; justify-content: center; margin-bottom: 24px;"> <div style="background-color: #f4f4f4; border-radius: 4px; flex-grow: 0; height: 14px; margin-bottom: 6px; width: 224px;"> </div> <div style="background-color: #f4f4f4; border-radius: 4px; flex-grow: 0; height: 14px; width: 144px;"> </div> </div> <p style="color: #c9c8cd; font-family: Arial,sans-serif; font-size: 14px; line-height: 17px; margin-bottom: 0; margin-top: 8px; overflow: hidden; padding: 8px 0 7px; text-align: center; text-overflow: ellipsis; white-space: nowrap;"><a style="color: #c9c8cd; font-family: Arial,sans-serif; font-size: 14px; font-style: normal; font-weight: normal; line-height: 17px; text-decoration: none;" href="https://www.instagram.com/p/CgNO32OsTdC/?utm_source=ig_embed&amp;utm_campaign=loading" target="_blank" rel="noopener">A post shared by Charles Spencer (@charles.earl.spencer)</a></p> </div> </blockquote> <p dir="ltr">The country experienced temperatures of 40.3 C in Coningsby on Tuesday, breaking 2019’s record by 1.6 degrees.</p> <p dir="ltr">The heat was followed by a welcome downpour that brought temperatures down to 19 C overnight in London.</p> <p dir="ltr">Sadiq Khan, the mayor of London, told Sky News it prompted a huge surge in calls to the city’s emergency services.</p> <p dir="ltr">“Yesterday was the busiest day for the fire services in London since the Second World War,” he told the program on Wednesday.</p> <p dir="ltr">The fire service received more than 2,600 calls - significantly higher than its usual 350-600 a day - with 41 properties destroyed and 16 firefighters injured.</p> <p dir="ltr">“The challenge in London is we have a lot of grass, a lot of green spaces and a lot of that impinges on properties. And when you have not had rain for a long period, when the grass is incredibly dry, fires can start very quickly and spread even faster because of wind and that leads to properties being destroyed,” Khan said.</p> <p dir="ltr">“A lot of the problems we have here today are a direct consequence of climate change, excess death because of the heat wave.</p> <p dir="ltr">“A lot of these problems can be solved by tackling climate change expediently, rather than kicking the can down the road.”</p> <p dir="ltr">Though the heat is expected to continue over the next couple weeks, the 14-day forecast has predicted significantly lower temperatures with tops of 28 C.</p> <p dir="ltr"><span id="docs-internal-guid-f7476775-7fff-f53f-ed8c-ed22aadd874a"></span></p> <p dir="ltr"><em>Images: Getty Images / Instagram</em></p>

News

Placeholder Content Image

Arctic heatwaves building in intensity

<div> <p>Ocean heatwaves in the Arctic are increasing in power and frequency, quite probably at a greater rate than in other oceans, according to new research.</p> <p>Marine heatwaves are events in which water temperatures rise well above normal and remain there for days, weeks, or even months. At lower latitudes, they can damage corals and force fish and marine mammals to temporarily move away in pursuit of food and cooler water. It’s an effect that has been compared to that of decades of climate change impact, but all at once.</p> <p>In the Arctic, the effect isn’t as well documented, but with climate change proceeding more dramatically there than at lower latitudes, a team led by Boyin Huang of the US National Oceanic and Atmospheric Administration’s National Centers for Environmental Information in Asheville, North Carolina, examined nearly four decades of US, European and Japanese satellite data to find out how climate change is altering the strength and frequency of these heatwaves.</p> <p>Huang presented his study this week at the 2022 Ocean Sciences Meeting, which for the first time was conducted entirely virtually. (Organisers had already said two years ago that they wanted to include a virtual component this year, in order to save resources and spare the climate, even before COVID-19 forced them to do so.)</p> <p>The study examined sea-surface temperatures,  air temperatures, ice coverage and the extent of cloud coverage, all of which can increase the likelihood of heatwaves. </p> <p>On average, Huang said, the Arctic sees one to two such heatwaves per summer. But over his study period, from 1982 to 2020, they were getting longer, stronger and extending ever deeper into autumn.</p> <p>In the early years, Huang says, the heatwaves were confined to a short season from late July to early August. Since then, however, that season has dramatically expanded, ending in mid-August or even through to the end of September.</p> <p>Other scientists are studying different types of changes in the Arctic that may (or may not) be related. For example, Michael Karcher, a senior researcher at the Alfred Wegener Institute for Polar and Marine Research in Bremerhaven, Germany, says scientists realised 25 years ago that plumes of iodine-129 (a rare, radioactive isotope of iodine) from nuclear fuel reprocessing plants in France and the UK can be used as a tracer of the flow of North Atlantic seawater into and around the Artic Ocean.</p> <p>What this has revealed, Karcher told the Ocean Sciences Meeting, is that there has been a change in the circulation pattern in the Arctic Ocean that has allowed relatively warm Atlantic Ocean water to penetrate further toward Alaska, reducing the spread of cooler Pacific water (which is not contaminated with iodine-129, and is therefore easy to distinguish).</p> <p>Karcher and Huang were unable to say whether this was contributing to Arctic heatwaves. In theory, the warmer water from the Atlantic should have some impact as it travels beneath the pack ice.</p> <p>“But how much it interacts with ice is the open question,” says Huang. “Our speculation is that atmospheric forcing [ie top-down heat] is the more important contributor.”</p> <p>The bottom line, however, is clear. Arctic waters are changing, and quickly.</p> <p>Huang’s research was published late last year in Geophysical Research Letters.</p> <p>This article originally appeared on <a href="https://cosmosmagazine.com/earth/oceans/ocean-arctic-heatwaves/" target="_blank" rel="noopener">cosmosmagazine.com</a> and was written by Richard A Lovett. </div> <div> </div> <div><em>Image: Shutterstock</em></div>

Travel Trouble

Placeholder Content Image

Extreme heat increases health risk for everyone

<div class="copy"> <p>Extreme heat is a <a rel="noreferrer noopener" href="https://cosmosmagazine.com/earth/climate/understanding-killer-heat/" target="_blank">killer</a>. It’s responsible for thousands of deaths around the world every year, with a huge proportion of those already <a rel="noreferrer noopener" href="https://cosmosmagazine.com/earth/climate/climate-change-causes-one-third-of-heat-related-deaths/" target="_blank">attributed to rising global temperatures</a>.</p> <p>Studies have long shown that people over the age of 65 face an increased risk of hospital admission and death during extreme heat days, but US and Canadian researchers have now found that young and middle-aged people are at risk, too.</p> <p>“By looking at emergency department visits for different causes and for several age groups, we were able to characterise with accuracy the varying impact on health on different populations,” says study co-author Francesca Dominici, from the Harvard T.H. Chan School of Public Health.</p> <p>“An important goal of this study is to provide actionable information to clinicians and public health experts regarding how to prevent these emergency department visits, also considering that we can anticipate when these extreme heat events are likely to occur.”</p> <p>Published in the <em>BMJ,</em> <a rel="noreferrer noopener" href="https://dx.doi.org/10.1136/BMJ-2021-065653" target="_blank">the study</a> found that extremely hot days – with an average temperature of 34.4°C – are associated with a higher risk of emergency department (ED) presentation for adults of all ages.</p> <p>The strongest association was for adults between the ages of 18 and 64.</p> <p>The study was large, spanning more than 74 million adults and 22 million ED visits across 2939 US counties during the months of May to September from 2010 to 2019. It used medical insurance claims data to investigate links between hot days and rates of ED visits for any cause as well as specific causes (namely heat-related illness, kidney disease, cardiovascular disease, respiratory disease and mental disorders).</p> <p>Extreme heat days increased people’s risk of an ED visit by 66% for a heat-related illness, as well as by 30% for renal disease.</p> <p>But the risk varied with age – there was a 10.3% higher risk of ED visits in people ages 45 to 54 years old, compared to a 3.6% higher risk in those older than 75.</p> <p>“Younger adults may be at greater risk of exposure to extreme heat, particularly among workers that spend substantial time outdoors,” says lead author Shengzhi Sun, from the Department of Environmental Health at Boston University School of Public Health (BUSPH). “Younger adults may also not realise that they too can be at risk on days of extreme heat.”</p> <p>Gregory Wellenius, professor of environmental health at BUSPH, says the researchers chose to look at ED visits instead of hospital admissions for a reason.</p> <p>“Many illnesses that lead to utilisation of the emergency department do not lead to hospitalisation because they can be treated in a short amount of time, particularly among the younger adult population,” he explains.</p> <p>“By looking at emergency room visits, we aimed to obtain a more comprehensive picture of the true burden of disease that might be attributed to the days of high heat.”</p> <p>The study also found differences in risk across regions – there was a higher risk of ED visits on extreme heat days in the US’s northwest, midwest and northwest, as opposed to the hotter southeast. The researchers say this shows heat is especially dangerous in cooler climates, where people may be less adapted to, or less aware of, heat.</p> <p>This is crucial to recognise as global temperatures rise, particularly as countries, states and regions are deciding how to adapt.</p> <p>“Although climate change is a global problem and heat threatens the health of everybody across the world, the impacts are felt locally, and the solutions have to be tailored to local needs,” says Wellenius.</p> <p>“What works for heatwave preparedness in the Pacific Northwest is really different from what works in the southeastern US, so the solutions have to be localised to accommodate the needs of the local community.” Extreme heat is a particular problem in cities. Exposure to deadly urban heat has <a rel="noreferrer noopener" href="https://cosmosmagazine.com/earth/climate/scorching-cities-deadly-urban-heat-has-tripled/" target="_blank">tripled</a> since the 1980s, and with more than 50% of the world’s population currently living in urban areas, this signals an urgent need to <a rel="noreferrer noopener" href="https://cosmosmagazine.com/cosmos-briefing/cities-of-the-future/" target="_blank">redesign our future cities</a> to keep us healthy as the world warms.</p> <em>Image credits: Getty Images </em></div> <div id="contributors"> <p><em>This article was originally published on <a rel="noopener" href="https://cosmosmagazine.com/health/body-and-mind/study-lays-bare-the-health-risks-of-extreme-heat/" target="_blank">cosmosmagazine.com</a> and was written by Lauren Fuge. </em></p> </div>

Body

Placeholder Content Image

5 major heatwaves in 30 years have turned the Great Barrier Reef into a bleached checkerboard

<p>Just 2% of the Great Barrier Reef remains untouched by bleaching since 1998 and 80% of individual reefs have bleached severely once, twice or three times since 2016, <a href="https://www.sciencedirect.com/science/article/abs/pii/S0960982221014901">our new study</a> reveals today.</p> <p>We measured the impacts of five marine heatwaves on the Great Barrier Reef over the past three decades: in 1998, 2002, 2016, 2017 and 2020. We found these bouts of extreme temperatures have transformed it into a checkerboard of bleached reefs with very different recent histories.</p> <p>Whether we still have a functioning Great Barrier Reef in the decades to come depends on how much higher we allow global temperatures to rise. The bleaching events we’ve already seen in recent years are a result of the world warming by 1.2℃ since pre-industrial times.</p> <p>World leaders meeting at the climate summit in Glasgow must commit to more ambitious promises to drastically cut greenhouse gas emissions. It’s vital for the future of corals reefs, and for the hundreds of millions of people who depend on them for their livelihoods and food security.</p> <h2>Coral in a hotter climate</h2> <p>The Great Barrier Reef is comprised of more than 3,000 individual reefs stretching for <a href="https://www.gbrmpa.gov.au/the-reef/reef-facts">2,300 kilometres</a>, and supports more than 60,000 jobs in reef <a href="https://www.gbrmpa.gov.au/our-work/Managing-multiple-uses/tourism-on-the-great-barrier-reef">tourism</a>.</p> <p>Under climate change, the frequency, intensity and scale of climate extremes is changing rapidly, including the record-breaking marine heatwaves that cause corals to bleach. Bleaching is a stress response by overheated corals, where they lose their colour and many struggle to survive.</p> <p>If all new COP26 pledges by individual countries are actually met, then the projected increase in average global warming could be brought down <a href="https://www.climate-resource.com/tools/ndcs">to 1.9℃</a>. In theory, this would put us in line with the goal of the Paris Agreement, which is to keep global warming below 2℃, but preferably 1.5℃, this century.</p> <p>However, it is still not enough to prevent the <a href="https://www.ipcc.ch/sr15/chapter/spm/">ongoing degradation</a> of the world’s coral reefs. The damage to coral reefs from anthropogenic heating so far is very clear, and further warming will continue to <a href="https://www.science.org/doi/10.1126/science.aan8048">ratchet down</a> reefs throughout the tropics.</p> <h2>Ecological memories of heatwaves</h2> <p>Most reefs today are in early <a href="https://www.aims.gov.au/reef-monitoring/gbr-condition-summary-2020-2021">recovery mode</a>, as coral populations begin to re-build since they last experienced bleaching in 2016, 2017 and 2020. It takes about a decade for a decent recovery of the fastest growing corals, and much longer for slow-growing species. Many coastal reefs that were severely bleached in 1998 have never fully recovered.</p> <p><a href="https://images.theconversation.com/files/430169/original/file-20211104-19-1po1sc2.jpg?ixlib=rb-1.1.0&amp;q=45&amp;auto=format&amp;w=1000&amp;fit=clip"><img src="https://images.theconversation.com/files/430169/original/file-20211104-19-1po1sc2.jpg?ixlib=rb-1.1.0&amp;q=45&amp;auto=format&amp;w=754&amp;fit=clip" alt="" /></a> <span class="caption">The fringing reef flat at Orpheus Island on the central Great Barrier Reef, prior to mass coral bleaching in 1998.</span> <span class="attribution"><span class="source">Bette Willis and Andrew Baird</span>, <span class="license">Author provided</span></span> <a href="https://images.theconversation.com/files/430168/original/file-20211104-27-16wyz5j.jpg?ixlib=rb-1.1.0&amp;q=45&amp;auto=format&amp;w=1000&amp;fit=clip"><img src="https://images.theconversation.com/files/430168/original/file-20211104-27-16wyz5j.jpg?ixlib=rb-1.1.0&amp;q=45&amp;auto=format&amp;w=754&amp;fit=clip" alt="" /></a> <span class="caption">The same reef flat at Orpheus Island after further bleaching in 2002 and 2016.</span> <span class="attribution"><span class="source">Bette Willis and Andrew Baird</span>, <span class="license">Author provided</span></span></p> <p>Each bleaching event so far has a different geographic footprint. Drawing upon <a href="https://www.mdpi.com/2072-4292/6/11/11579">satellite data</a>, we measured the duration and intensity of heat stress that the Great Barrier Reef experienced each summer, to explain why different parts were affected during all five events.</p> <p>The bleaching responses of corals differed greatly in each event, and was strongly influenced by the recent history of previous bleaching. For this reason, it’s important to measure the extent and severity of bleaching directly, where it actually occurs, and not rely exclusively on water temperature data from satellites as an indirect proxy.</p> <p>We found the most vulnerable reefs each year were the ones that had not bleached for a decade or longer. On the other hand, when successive episodes were close together in time (one to four years apart), the heat threshold for severe bleaching increased. In other words, the earlier event had hardened regions of the Great Barrier Reef to subsequent impacts.</p> <p><a href="https://images.theconversation.com/files/430176/original/file-20211104-15-noksid.jpg?ixlib=rb-1.1.0&amp;q=45&amp;auto=format&amp;w=1000&amp;fit=clip"><img src="https://images.theconversation.com/files/430176/original/file-20211104-15-noksid.jpg?ixlib=rb-1.1.0&amp;q=45&amp;auto=format&amp;w=754&amp;fit=clip" alt="Bleached coral" /></a> <span class="caption">Bleaching is a stress response by overheated corals.</span> <span class="attribution"><span class="source">Shutterstock</span></span></p> <p>For example, in 2002 and 2017, it took much more heat to trigger similar levels of bleaching that were measured in 1998 and 2016. The threshold for bleaching was much higher on reefs that had experienced an earlier episode of heat stress.</p> <p>Similarly, southern corals, which escaped bleaching in 2016 and 2017, were the most vulnerable in 2020, compared to central and northern reefs that had bleached severely in previous events.</p> <p>Many different mechanisms could generate these historical effects, or ecological memories. One is <a href="https://www.nature.com/articles/s41586-018-0041-2">heavy losses</a> of the more heat-susceptible coral species during an earlier event – dead corals don’t re-bleach.</p> <p>Nowhere left to hide</p> <p>Only a single cluster of reefs remains unbleached in the far south, downstream from the rest of the Great Barrier Reef, in a small region that has remained consistently cool through the summer months during all five mass bleaching events. These reefs lie at the outer edge of the Great Barrier Reef, where upwelling of cool water may offer some protection from heatwaves, at least so far.<a href="https://images.theconversation.com/files/430397/original/file-20211104-23-29h946.png?ixlib=rb-1.1.0&amp;q=45&amp;auto=format&amp;w=1000&amp;fit=clip"><img src="https://images.theconversation.com/files/430397/original/file-20211104-23-29h946.png?ixlib=rb-1.1.0&amp;q=45&amp;auto=format&amp;w=754&amp;fit=clip" alt="" /></a> <span class="caption">Map of the Great Barrier Reef showing the cumulative level of bleaching observed in 2016, 2017 and 2020. The colours represent the intensity of bleaching, ranging from zero (category 1, dark blue) to severe bleaching that affected more than 60% of corals (category 4, red)</span> <span class="attribution"><span class="source">Author provided</span></span></p> <p>In theory, a judiciously placed network of well-protected, climate-resistant reefs might help to repopulate the <a href="https://conbio.onlinelibrary.wiley.com/doi/full/10.1111/conl.12587">broader seascape</a>, if greenhouse gas emissions are curtailed to stabilise temperatures later this century.</p> <p>But the unbleached southern reefs are too few in number, and too far away from the rest of the Great Barrier Reef to produce and deliver sufficient coral larvae, to promote a long-distance recovery.</p> <p>Instead, future replenishment of depleted coral populations is more likely to be local. It would come from the billions of larvae produced by recovering adults on nearby reefs that have not bleached for a while, or by corals inhabiting reef in deeper waters which tend to experience less heat stress than those living in shallow water.</p> <p>Future recovery of corals will increasingly be temporary and incomplete, before being interrupted again by the inevitable next bleaching event. Consequently, the patchiness of living coral on the Great Barrier Reef will increase further, and corals will continue to decline under climate change.</p> <p>Our findings make it clear we no longer have the luxury of studying individual climate-related events that were once unprecedented, or very rare. Instead, as the world gets hotter, it’s increasingly important to understand the effects and combined outcomes of sequences of rapid-fire catastrophes.<!-- Below is The Conversation's page counter tag. Please DO NOT REMOVE. --><img style="border: none !important; box-shadow: none !important; margin: 0 !important; max-height: 1px !important; max-width: 1px !important; min-height: 1px !important; min-width: 1px !important; opacity: 0 !important; outline: none !important; padding: 0 !important; text-shadow: none !important;" src="https://counter.theconversation.com/content/170719/count.gif?distributor=republish-lightbox-basic" alt="The Conversation" width="1" height="1" /><!-- End of code. If you don't see any code above, please get new code from the Advanced tab after you click the republish button. The page counter does not collect any personal data. More info: https://theconversation.com/republishing-guidelines --></p> <p><span><a href="https://theconversation.com/profiles/terry-hughes-9894">Terry Hughes</a>, Distinguished Professor, <em><a href="https://theconversation.com/institutions/james-cook-university-1167">James Cook University</a></em> and <a href="https://theconversation.com/profiles/sean-connolly-94343">Sean Connolly</a>, Research Biologist, <em><a href="https://theconversation.com/institutions/smithsonian-institution-1227">Smithsonian Institution</a></em></span></p> <p>This article is republished from <a href="https://theconversation.com">The Conversation</a> under a Creative Commons license. Read the <a href="https://theconversation.com/5-major-heatwaves-in-30-years-have-turned-the-great-barrier-reef-into-a-bleached-checkerboard-170719">original article</a>.</p>

Domestic Travel

Placeholder Content Image

Marine heatwaves during winter could have dire impacts on New Zealand fisheries and herald more summer storms

<p>The ocean around New Zealand is getting warmer, and extreme warming events have become more frequent over the past years.</p> <p>These marine heatwaves can have devastating impacts on ocean ecosystems. When they happen in summer, they usually receive a lot of attention. But those happening during winter, when the ocean is cooler, are often ignored.</p> <p>Yet, these winter events can affect the spawning and recruitment of fish and other sea animals, and in turn have significant impacts on aquaculture and fisheries.</p> <p>To monitor the occurrence of such extreme events around New Zealand, we developed a <a href="https://www.moanaproject.org/marine-heatwave-forecast">marine heatwave forecast tool</a> as part of the <a href="https://www.moanaproject.org/">Moana Project</a>. The tool has been operational since January 2021 and it forecasts marine heatwave occurrence, intensity and duration for 13 areas defined in collaboration with the seafood industry.</p> <p>It revealed that most coastal areas around New Zealand were warmer than normal during this last winter (June to August 2021), as highlighted in the map showing the difference between winter 2021 average sea surface temperatures and the climatology (daily mean values based on data from 25 years).</p> <p><img src="https://images.theconversation.com/files/423715/original/file-20210929-18-37hxt5.jpg?ixlib=rb-1.1.0&amp;q=45&amp;auto=format&amp;w=754&amp;fit=clip" alt="Map of ocean warming around New Zealand." /> <span class="caption">Temperature anomaly in relation to 25 years of climate data. The boxes show the regions where detailed analysis and detection of marine heatwaves is carried out.</span> <span class="attribution"><span class="license">Author provided</span></span></p> <h2>A warm winter for New Zealand’s waters</h2> <p>Marine heatwaves are defined as periods of five days or more of ocean temperatures in the top 10% of local average values for the time of year.</p> <p>During winter 2021, surface waters were on average 0.3℃ (±0.75) warmer than usual, with peaks occasionally reaching +4.2℃. In contrast, in a few areas, such as the Pegasus and Kaikoura canyons to the north-east of Banks Peninsula, we observed cooler than normal temperatures.</p> <p>Except for the Banks Peninsula and the FMA3 box to the east of the South Island, all other 11 areas experienced marine heatwaves during the winter.</p> <p>The events varied in intensity and duration. While Cape Reinga showed a continuous moderate event, Stewart Island experienced a severe winter marine heatwave that lasted 87 days, with maximum temperatures reaching 1.9℃ above long-term climate data.</p> <p><img src="https://images.theconversation.com/files/423952/original/file-20210929-65532-1d407vf.png?ixlib=rb-1.1.0&amp;q=45&amp;auto=format&amp;w=754&amp;fit=clip" alt="This graph depicts ocean temperature anomalies around Stewart Island." /> <span class="caption">Sea surface temperatures for Stewart Island. The blue line shows the daily mean temperatures and the green line the 10% highest temperatures, calculated from a period of 25 years. The shaded red area indicates a marine heatwave.</span> <span class="attribution"><span class="license">Author provided</span></span></p> <p>Both areas are particularly important since they are located at the northern and southern extremities, respectively, of the main currents that hug the eastern coastline of New Zealand. The warm waters in these regions move downstream (southward from Cape Reinga, and north-eastward from Stewart Island) and warm most of New Zealand’s eastern coast.</p> <p>We can expect serious economic impacts from such warming. Recent events in western Canada <a href="https://www.washingtonpost.com/world/2021/07/08/canada-sea-creatures-boiling-to-death/">highlight</a> the devastating impact summer marine heatwaves can have on coastal marine ecosystems and aquaculture.</p> <p>In New Zealand, Fisheries Management Area 7 (FMA7) in the map matches hoki spawning grounds and is, therefore, of critical importance to deep-water fisheries. The hoki fishery is worth about NZ$230 million in export revenue. In 2017, the fishery’s catch shortfall was about 8,500 tonnes, which constitutes a loss to the New Zealand economy of some NZ$13 million.</p> <p><img src="https://images.theconversation.com/files/423953/original/file-20210929-64991-1q3ju2n.png?ixlib=rb-1.1.0&amp;q=45&amp;auto=format&amp;w=754&amp;fit=clip" alt="This graph shows the ocean temperature anomalies in an area where hoki spawn." /> <span class="caption">Sea surface temperatures for the fisheries management area where hoki spawn. The red areas show the occurrence of marine heatwaves this past winter.</span> <span class="attribution"><span class="license">Author provided</span></span></p> <p>While the reasons for this are not yet fully understood, the <a href="https://deepwatergroup.org/">Deepwater Group</a>, which represent quota owners from New Zealand’s deep-water fisheries, suspects warmer-than-usual temperatures resulted in fewer hoki arriving at the winter spawning grounds off the west coast of the South Island.</p> <p>A greater focus on winter marine heatwaves will help us understand how fisheries and aquaculture in New Zealand may be affected and what we can do to minimise economic, societal and biodiversity losses.</p> <h2>Changes across the southwest Pacific affect New Zealand</h2> <p>We know ocean temperatures are warming faster during winter than summer <a href="https://www.nature.com/articles/s41598-017-14944-2">around New Zealand</a> and across the wider <a href="https://journals.ametsoc.org/view/journals/clim/aop/JCLI-D-20-0886.1/JCLI-D-20-0886.1.xml">subtropical southwest Pacific Ocean</a>. The warming has become particularly evident since 2010 and has manifested in the emergence of the “Southern Blob”.</p> <p>This ocean hotspot is centred northeast of New Zealand and has been linked to <a href="https://www.smh.com.au/environment/climate-change/southern-blob-of-unusual-pacific-heat-blamed-for-creating-megadrought-20210826-p58m7p.html">drought</a> in both <a href="https://www.theguardian.com/environment/2021/aug/27/how-a-hot-blob-off-new-zealand-is-contributing-to-drought-in-south-america">South America</a> and New Zealand.</p> <p>The current rate of warming in the Southern Blob <a href="https://journals.ametsoc.org/view/journals/clim/aop/JCLI-D-20-0886.1/JCLI-D-20-0886.1.xml">exceeds natural variability</a>, implying a contribution from human-induced climate change. Along with changes in the regional atmosphere, this large-scale process increases the likelihood of winter marine heatwaves around New Zealand.</p> <p>Our <a href="https://agupubs.onlinelibrary.wiley.com/doi/10.1029/2021GL094785">research</a> shows the deepest and longest-lasting marine heatwaves in the Tasman Sea are typically driven by ocean currents — in contrast to shallower summer marine heatwaves, which are driven by the atmosphere.</p> <p>The warmer-than-normal winter ocean temperatures in the Tasman and coastal seas around New Zealand send warning signals about what the summer may bring. On top of impacts on coastal ecosystems, marine heatwaves also affect extreme weather and make floods and tropical storms over New Zealand more likely during the coming summer.<!-- Below is The Conversation's page counter tag. Please DO NOT REMOVE. --><img style="border: none !important; box-shadow: none !important; margin: 0 !important; max-height: 1px !important; max-width: 1px !important; min-height: 1px !important; min-width: 1px !important; opacity: 0 !important; outline: none !important; padding: 0 !important; text-shadow: none !important;" src="https://counter.theconversation.com/content/167967/count.gif?distributor=republish-lightbox-basic" alt="The Conversation" width="1" height="1" /><!-- End of code. If you don't see any code above, please get new code from the Advanced tab after you click the republish button. The page counter does not collect any personal data. More info: https://theconversation.com/republishing-guidelines --></p> <p><span><a href="https://theconversation.com/profiles/joao-marcos-azevedo-correia-de-souza-1270882">João Marcos Azevedo Correia de Souza</a>, MetOcean Solutions Science Manager of the Research and Development Team. Moana Project Science Lead, <em><a href="https://theconversation.com/institutions/metservice-te-ratonga-tirorangi-5124">MetService — Te Ratonga Tirorangi</a></em>; <a href="https://theconversation.com/profiles/amandine-schaeffer-1271998">Amandine Schaeffer</a>, , <em><a href="https://theconversation.com/institutions/unsw-1414">UNSW</a></em>; <a href="https://theconversation.com/profiles/jonathan-gardner-1271684">Jonathan Gardner</a>, , <em><a href="https://theconversation.com/institutions/te-herenga-waka-victoria-university-of-wellington-1200">Te Herenga Waka — Victoria University of Wellington</a></em>, and <a href="https://theconversation.com/profiles/robert-smith-1271656">Robert Smith</a>, </span></p> <p>This article is republished from <a href="https://theconversation.com">The Conversation</a> under a Creative Commons license. Read the <a href="https://theconversation.com/marine-heatwaves-during-winter-could-have-dire-impacts-on-new-zealand-fisheries-and-herald-more-summer-storms-167967">original article</a>.</p>

Domestic Travel

Placeholder Content Image

Anatomy of a heatwave: how Antarctica recorded a 20.75°C day last month

<p>While the world rightfully focuses on the COVID-19 pandemic, the planet is still warming. This summer’s Antarctic weather, as elsewhere in the world, was unprecedented in the observed record.</p> <p>Our research, published today in <a href="https://doi.org/10.1111/GCB.15083">Global Change Biology</a>, describes the recent heatwave in Antarctica. Beginning in late spring east of the Antarctic Peninsula, it circumnavigated the continent over the next four months. Some of our team spent the summer in Antarctica observing these temperatures and the effect on natural systems, witnessing the heatwave first-hand.</p> 
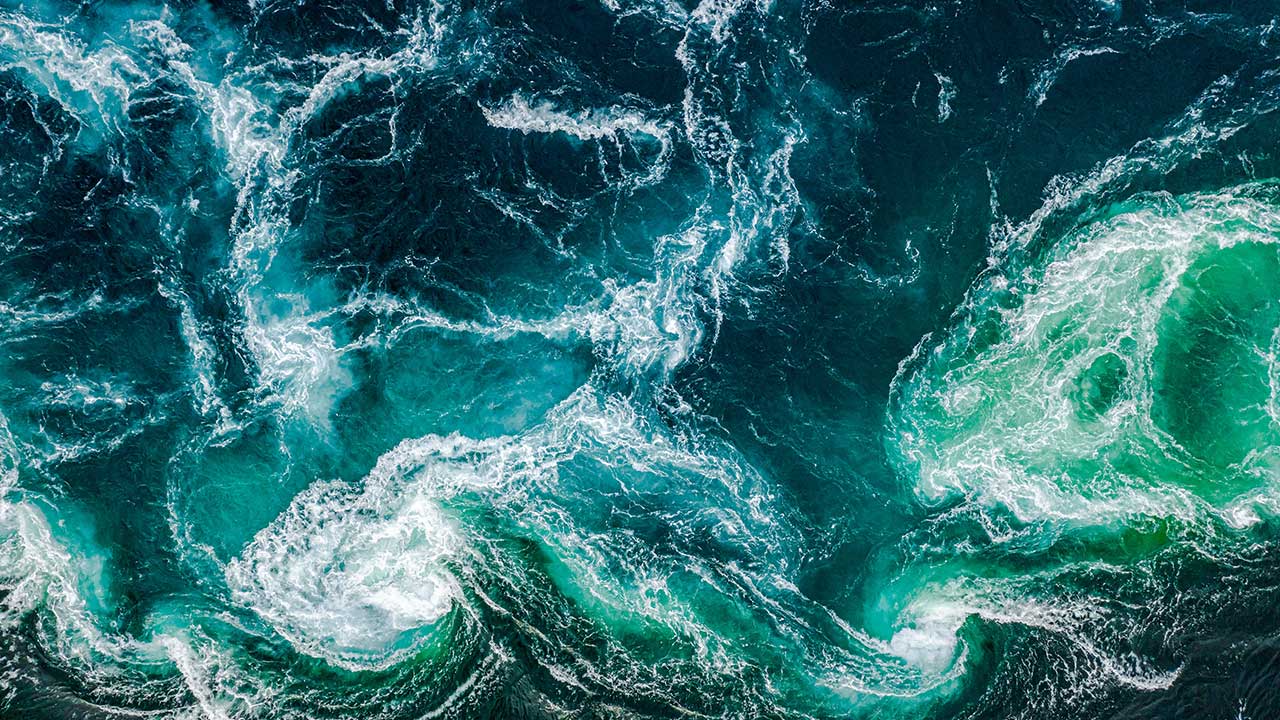
<p>Antarctica may be isolated from other continents by the Southern Ocean, but has worldwide impacts. It drives the <a href="https://oceanservice.noaa.gov/facts/conveyor.html">global ocean conveyor belt</a>, a constant system of deep-ocean circulation which transfers oceanic heat around the planet, and its melting ice sheet adds to global sea level rise.</p> 
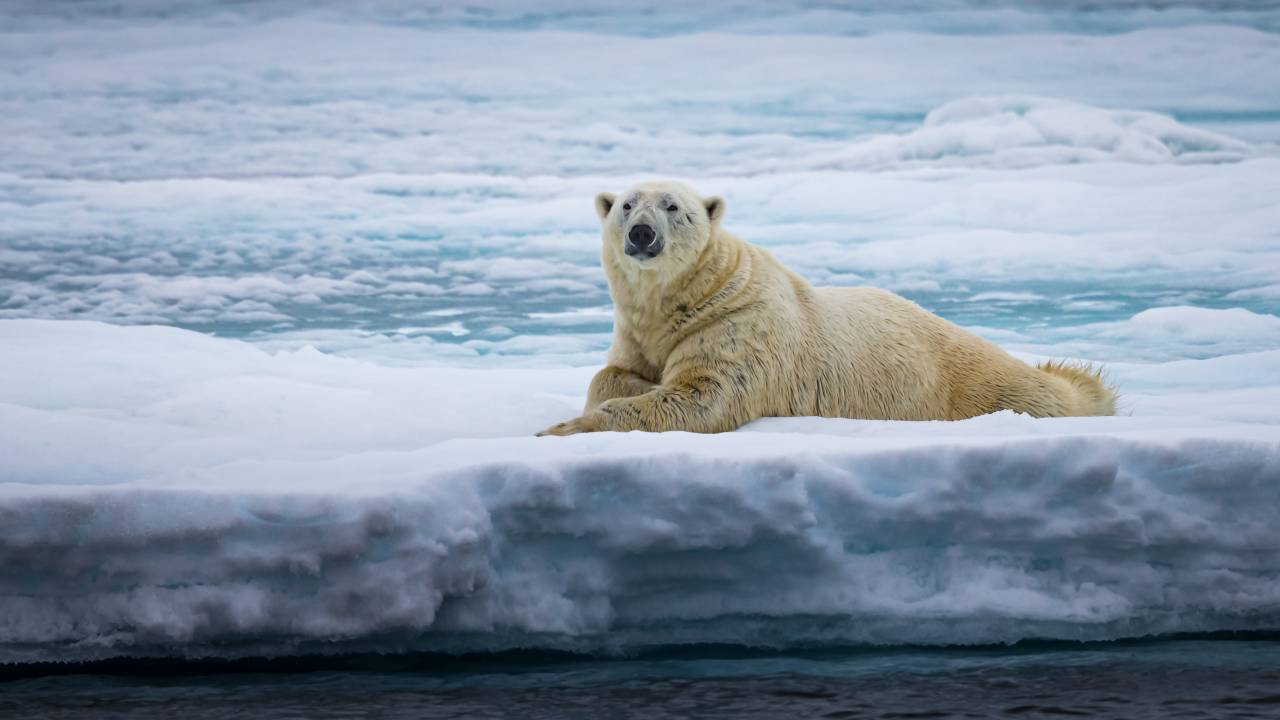
<p>Antarctica represents the simple, extreme end of conditions for life. It can be seen as a ‘canary in the mine’, demonstrating patterns of change we can expect to see elsewhere.</p> <p><strong>A heatwave in the coldest place on Earth</strong></p> <p>Most of Antarctica is ice-covered, but there are small ice-free oases, predominantly on the coast. Collectively 0.44% of the continent, these unique areas are <a href="http://www.antarctica.gov.au/news/2019/ice-free-areas-are-hot-property-in-antarctica">important biodiversity hotspots</a> for penguins and other seabirds, mosses, lichens, lakes, ponds and associated invertebrates.</p> <p>This summer, Casey Research Station, in the Windmill Islands oasis, experienced its first recorded heat wave. For three days, minimum temperatures exceeded zero and daily maximums were all above 7.5°C. On January 24, its highest <a href="http://www.bom.gov.au/climate/averages/tables/cw_300017.shtml">maximum of 9.2°C</a> was recorded, almost 7°C above Casey’s 30-year mean for the month.</p> 
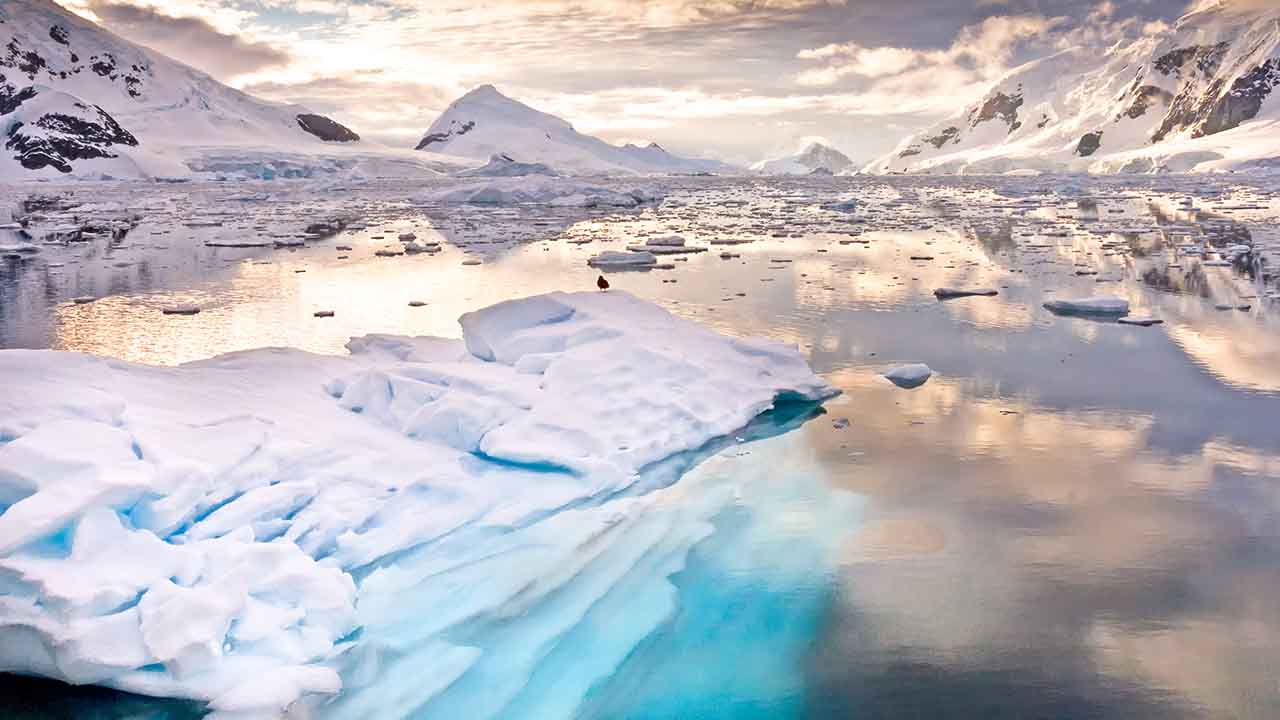
<p>The arrival of warm, moist air during this weather event brought rain to Davis Research Station in the normally frigid, ice-free desert of the Vestfold Hills. The warm conditions triggered extensive meltwater pools and surface streams on local glaciers. These, together with melting snowbanks, contributed to high-flowing rivers and flooding lakes.</p> <p>By February, most heat was concentrated in the Antarctic Peninsula at the northernmost part of the continent. A new Antarctic <a href="https://public.wmo.int/en/media/news/new-record-antarctic-continent-reported/">maximum temperature of 18.4°C</a> was recorded on February 6 at Argentina’s Esperanza research station on the Peninsula - almost 1°C above the previous record. Three days later this was eclipsed when <a href="https://www.theguardian.com/world/%202020/feb/13/antarctic-temperature-rises-above-20c-firsttime-record/">20.75°C was reported</a> at Brazil’s Marambio station, on Seymour Island east of the Peninsula.</p> <p><strong>What caused the heatwave?</strong></p> <p>The pace of warming from global climate change has been generally slower in East Antarctica compared with West Antarctica and the Antarctic Peninsula. This is in part due to the <a href="https://theconversation.com/after-30-years-of-the-montreal-protocol-the-ozone-layer-is-gradually-healing-84051">ozone hole</a>, which has occurred in spring over Antarctica since the late 1970s.</p> <p>The hole has tended to strengthen jet stream winds over the <a href="https://theconversation.com/the-ozone-hole-leaves-a-lasting-impression-on-southern-climate-34043">Southern Ocean</a> promoting a generally <a href="https://www.nature.com/articles/d41586-020-00787-x">more ‘positive’ state</a> of the Southern Annular Mode in summer. This means the Southern Ocean’s westerly wind belt has tended to stay close to Antarctica at that time of year creating a seasonal ‘shield’, reducing the transfer of warm air from the Earth’s temperate regions to Antarctica.</p> <p>But during the spring of 2019 a <a href="https://theconversation.com/the-air-above-antarctica-is-suddenly-getting-warmer-heres-what-it-means-for-australia-123080">strong warming of the stratosphere</a> over Antarctica significantly reduced the size of the ozone hole. This helped to support a more ‘negative’ state of the Southern Annular Mode and weakened the shield.</p> <p>Other factors in late 2019 may have also helped to warm Antarctica. The Indian Ocean Dipole was in a strong ‘positive’ state due to a <a href="https://theconversation.com/a-hot-and-dry-australian-summer-means-heatwaves-and-fire-risk-ahead-127990">late retreat of the Indian monsoon</a>. This meant that water in the western Indian Ocean was warmer than normal. Air rising from this and other warm ocean patches in the Pacific Ocean provided energy sources that altered the path of weather systems and helped to disturb and warm the stratosphere.</p> <p><strong>Is a warming Antarctica good or bad?</strong></p> <p>Localised flooding appeared to benefit some Vestfold Hills’ moss banks which were previously very <a href="https://www.nature.com/articles/s41558-018-0280-0">drought-stressed</a>. Prior to the flood event, most mosses were grey and moribund, but one month later many moss shoots were green.</p> <p>Given the generally cold conditions of Antarctica, the warmth may have benefited the flora (mosses, lichens and two vascular plants), and microbes and invertebrates, but only where liquid water formed. Areas in the Vestfold Hills away from the flooding became more drought-stressed over the summer.</p> <p>High temperatures may have caused heat stress in some organisms. Antarctic mosses and lichens are often dark in colour, allowing sunlight to be absorbed to create warm microclimates. This is a great strategy when temperatures are just above freezing, but heat stress can occur once 10°C is exceeded.</p> <p>On King George Island, near the Antarctic Peninsula, our measurements showed that in January 2019 moss surface temperatures only exceeded 14°C for 3% of the time, but in 2020 this increased fourfold (to 12% of the time).</p> <p>Based on our experience from previous anomalous hot Antarctic summers, we can expect many biological impacts, positive and negative, in coming years. The most recent event highlights the connectedness of our climate systems: from the surface to the stratosphere, and from the monsoon tropics to the southernmost continent.</p> <p>Under climate change, extreme events are predicted to increase in frequency and severity, and Antarctica is not immune.</p> <p>If you’ve been let go and then retrospectively un-sacked, you are also guaranteed to get at least $1,500 per fortnight, which in that case might be less than you were being paid, but will be more than the $1,115 you would have got on Newstart (which has been renamed JobSeeker Payment).</p> <p>If you remain employed, and are on more than $1,500 per fortnight, the employer will have to pay you your full regular wage. Employers won’t be able to cut it to $1,500 per fortnight.</p> <p>To get it, most employers will have to have suffered a 30% decline in their turnover relative to a comparable period a year ago. Big employers (turnover of $1 billion or more) will have to have suffered a 50% decline. Big banks won’t be eligible.</p> <p>Self-employed Australians will also be eligible where they have suffered or expect to suffer a 30% decline in turnover. Among these will be musicians and performers out of work because large gatherings have been cancelled.</p> <p><strong>Half the Australian workforce</strong></p> <p>The payment isn’t perfect. It will only be paid in respect of wages from March 30, and the money won’t be handed over until the start of May – the Tax Office systems can’t work any faster – but it will provide more support than almost anyone expected.</p> <p>Its scope is apparent when you consider the size of Australia’s workforce.</p> <p>Before the coronavirus hit in February, 13 million of Australia’s 25 million residents were in jobs. This payment will go to <a href="https://ministers.treasury.gov.au/ministers/josh-frydenberg-2018/media-releases/130-billion-jobkeeper-payment-keep-australians-job">six million</a> of them.</p> <p>Without putting too fine a point on it, for the next six months, the government will be the paymaster to almost <a href="https://www.abs.gov.au/ausstats/abs@.nsf/mf/6202.0">half</a> the Australian workforce.</p> <p>Announcing the payment, Prime Minister Scott Morrison said unprecedented times called for unprecedented action. He said the payment was more generous than New Zealand’s, broader than Britain’s, and more comprehensive than Canada’s, claims about which there is dispute.</p> <p>But for Australia, it is completely without precedent.</p> <p><em>Written by Dana M Bergstrom, Andrew Klekociuk, Diana Kind and Sharon Robinson. Reviewed by Emma Kucelj. Republished with permission of </em><a href="https://theconversation.com/anatomy-of-a-heatwave-how-antarctica-recorded-a-20-75-c-day-last-month-134550"><em>The Conversation.</em></a></p> <p><em> </em></p>

Cruising